Introductory Tour
The Introductory Tour is a brief visual tour of the main HST eChart screens and components.
This page covers: the Schedule Tab, Chart Home, Menu, and Workflow. All screens and features are covered in depth in subsequent help file topics.
Schedule Tab
Most users will see the schedule tab as their default start screen tab after logging into eChart. A different default start screen can be configured in user preferences.
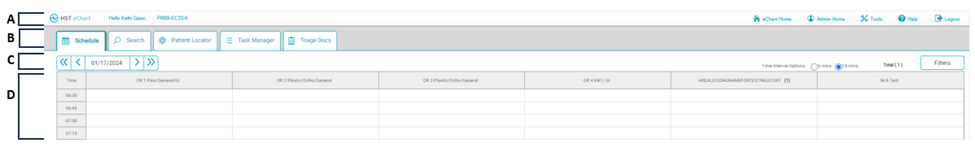
- A: The eChart Toolbar – The toolbar is always present at the top of HST eChart. Tapping the HST eChart logo on the left-hand side will take the user back to the HST eChart Home Page to whichever tab they were last viewing. The user’s name and Center name are displayed next in the toolbar. On the right side of the toolbar are Home, Admin, Help, and Logout buttons. If the user has access to more than one center, hovering over the center name will show other centers. To navigate to a different center, the user can click on the name of that center.
- B: Schedule, Search, Patient Locator, Task Manager, and Triage Docs Tabs – The eChart Schedule Tab displays the scheduled cases. The Search Tab allows the user to search for a chart. The Patient Locator Tab displays the location and status of patients currently at the Center. The Task Manager Tab is where users view the tasks that have been assigned for them to complete. In the Triage Docs Tab operative reports are triaged and attached to charts.
- C: Date selector - The user can use the date selector to view the schedule for different dates. When the Schedule is initially opened, the date defaults to the current date. Single arrows
 navigate by one day; double arrows
  navigate by one week.
 - D: The Schedule: The schedule displays all scheduled cases for the day. The schedule can be filtered to view only selected room or surgeon’s cases. When a user logs out the filters are reset. Single tap on a case to open the chart.
Chart Home
When most users open a chart, the Chart Home screen will be the default workflow screen. The default workflow screen can be configured to a different workflow in User Preferences, which is located in the Tools menu in the toolbar.
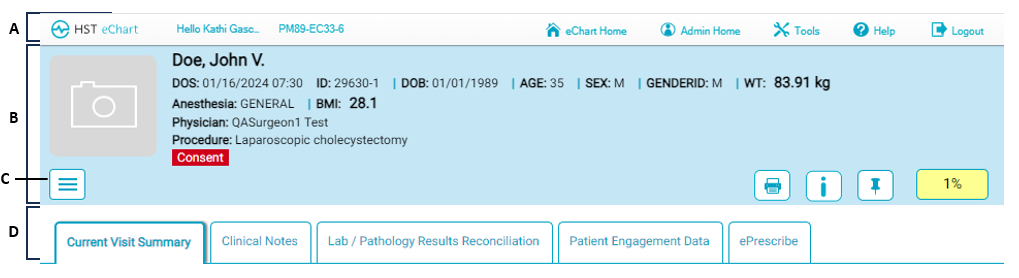
- A: The Toolbar
- B: The
- C: Menu Icon – Clicking on the menu icon will open the menu displaying all area workflows. Tapping on a workflow will open it. Tap a workflow or the menu icon to close the menu.
D: Chart Home Tabs – The Chart Home has up to five tabs: Current Visit Summary Tab, Previous Visit Summary Tab, Clinical Notes Tab, Lab/Pathology Results Reconciliation Tab, and Patient Portal Data or Patient Engagement Data Tab. The number of tabs visible depends on the Center's set up and the user's permissions. Tap on the tab to view its contents.
Current Visit Summary collects a summary of clinical information for each visit. The summary includes all medications that have been administered, current home medications, allergies, vital signs from all clinical areas, patient problem list, any in-house lab results, any documents associated with the chart, and patient address.
Previous Visits Summary will show a list of all previous visits both performed and cancelled, as well as the Home Medications, Allergies, and Problem List information confirmed in the most recent previous visit. The user can tap on a previous visit to view the summary of that visit.
A user can enter a note, visible to other users, in the Clinical Notes tab. The note is not part of the printed chart and is only applied to the current visit.
Lab/Pathology Results Reconciliation is where lab or pathology results are associated with lab or pathology tests that were charted in HST eChart.
If the center is using HST Patient Engagement and its HST eChart integration, this tab name will be Patient Engagement Data and will allow the user to view the health information submitted by the patient in HST Patient Engagement, review, and import the information into the chart. Patient Portal Data is where any information completed by the patient in a third party application will be visible (if the center is not using HST Patient Engagement).
Menu
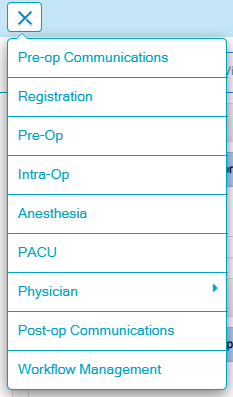
Tapping the menu icon will display the chart’s workflow areas. Different chart templates may have different workflow areas. Users may only have access to certain areas depending on their user permissions, which are configured by the Center’s system administrator. If a user does not have permissions for a workflow, a lock icon will display.
From the menu, tap on a workflow to open it.
Workflow
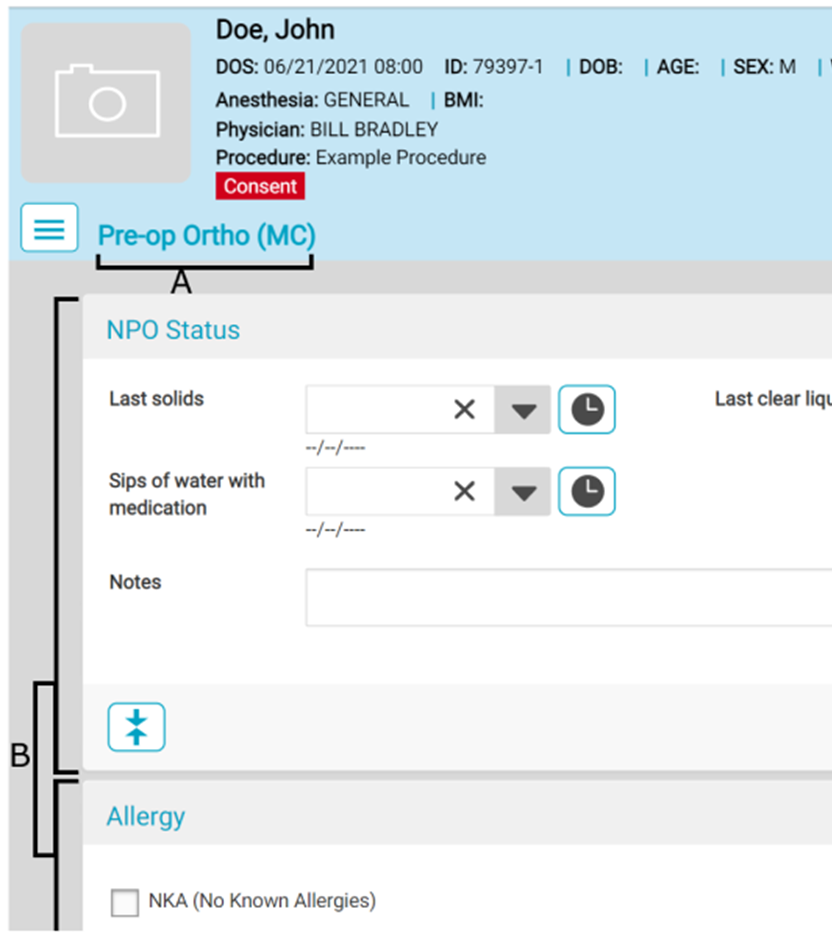
The Toolbar and Patient Header are at the top of each Workflow.
- A: Workflow – The name of the current workflow is to the right of the menu icon.
- B:BLOCs – Workflows are made of assorted BLOCs (Basic Levels Of Charting) The default BLOCs in a workflow are configured in Chart Designer. Certain BLOCs, such as Allergy, may be present in multiple workflows in the same chart and the data entered in the BLOC in one workflow may display in the same BLOC in another workflow. A user can add a BLOC to a workflow on the fly. A user may also be able to remove a BLOC from the workflow on the fly.